Calculate Your Immersive Recruiting ROI
Enter your exact numbers. Get a personalized 13-page PDF report showing what turnover and vacancies cost you today — and what you could save with immersive recruiting. Your report arrives in less than 10 minutes.

Early Turnover Is Crushing Your Recruiting ROI
You spend thousands to hire someone. Then they leave within 90 days. The cycle repeats. The costs add up. Most organizations accept this as normal — but the data says it's preventable.
The 4 Hidden Costs Breaking Your Recruiting Budget
Early turnover isn't just a recruiting problem — it's an operations drain. Every exit triggers a cascade of costs you're already paying but probably not tracking.
Vacancy Cost
Every day a position sits empty costs you productivity. The longer your time-to-fill, the more you lose.
Replacement Cost
When someone leaves, you pay to replace them: sourcing, screening, interviewing, onboarding. This costs 0.5×–2× salary.
Training Waste
Every new hire absorbs training time. When they leave early, that investment walks out the door.
The Experience Gap
"This isn't what I expected" is the #1 reason for early turnover. Candidates don't understand the job until they're in it.
How much is early turnover costing YOU?
Enter your numbers. Get a personalized 13-page report showing your current costs and projected savings.
What's In Your 13-Page ROI Report
This isn't a generic PDF. Your report is calculated from your exact numbers — the same analysis a consultant would charge thousands to build.
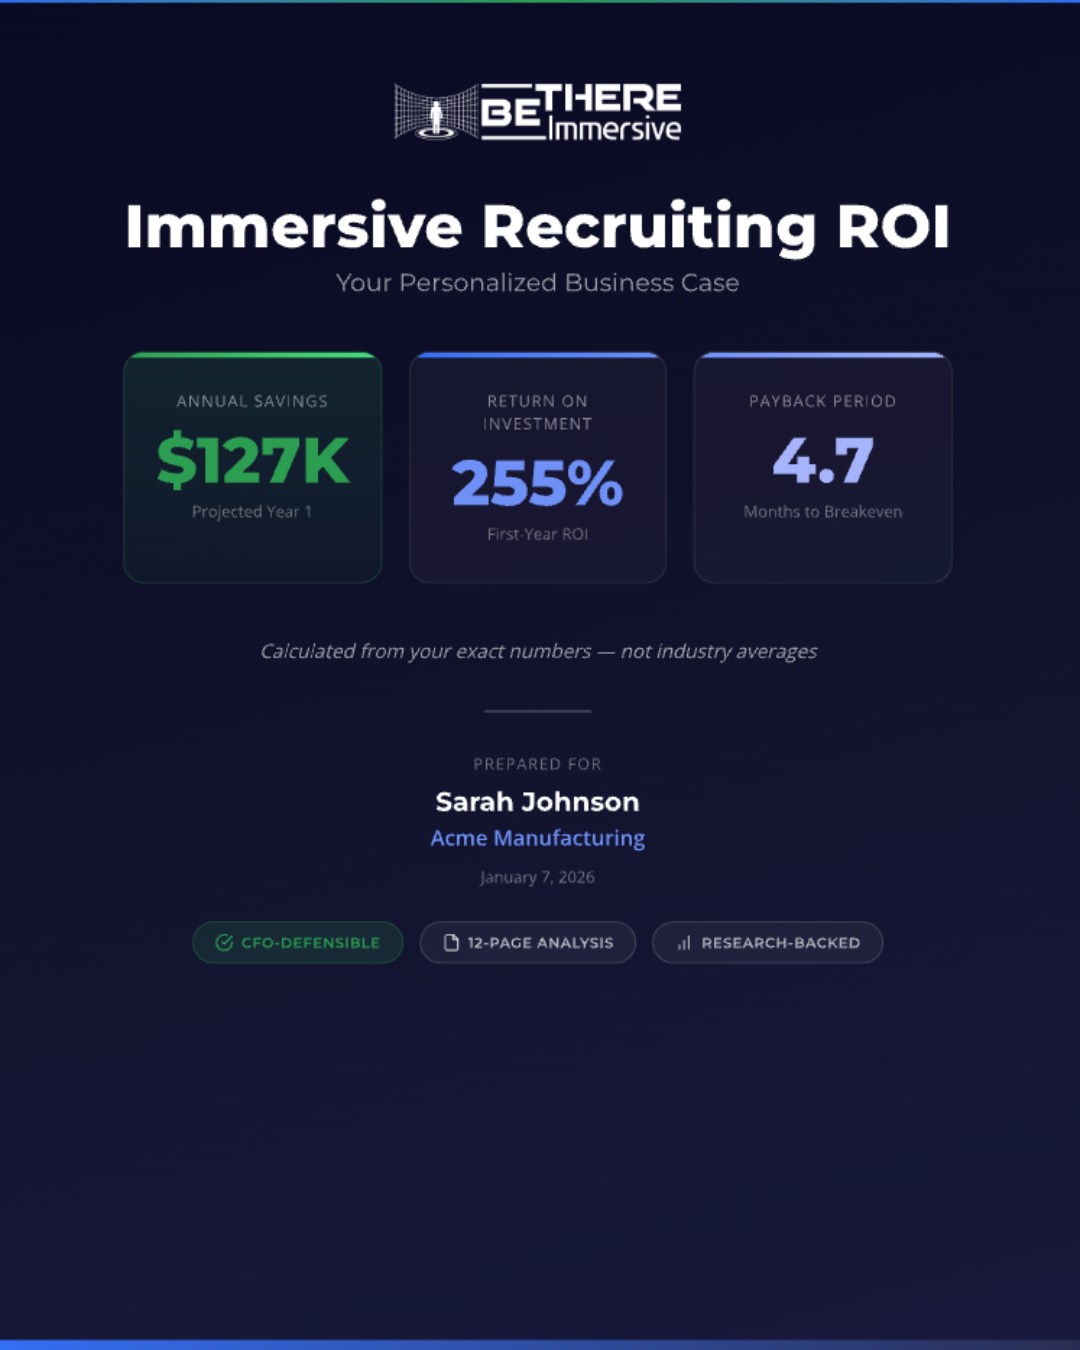
Your ROI at a Glance
Total savings, ROI percentage, and payback period — personalized with your exact numbers. Executive summary ready to share.
Show-Your-Work Math
Every formula transparent. Vacancy costs, turnover costs, and projected savings — verify the math yourself.
Research-Backed Methodology
Based on SHRM, Gallup, MIT Sloan, and PwC research. Includes sensitivity analysis and measurement framework.
Clear Next Steps
What to do with this report, who to share it with, and how to schedule a discovery call.
The Research Behind the Calculator
These calculations aren't guesswork. They're based on peer-reviewed research and industry benchmarks.
Replacement Cost Multipliers
Replacing an employee costs 0.5× to 2.0× their annual salary—and that's a conservative estimate.
Gallup, 2019 →VR Reduces Turnover by 31%
Indiana Child Welfare used VR job simulations to cut staff turnover by 31%. Pilot regions saw 64% reduction.
MIT Sloan, 2020 →VR Training: 4× Faster
VR learners complete training 4× faster, are 275% more confident to apply skills, and are 4× more focused than e-learners.
PwC, 2020 →Industry Benchmarks
National average time-to-fill: 42 days. Average cost-per-hire: $4,700. These are YOUR starting points.
SHRM, 2022 →The Math Is Simple
You're already spending this money. The question is whether you want to keep losing it.
ROI Calculator: Common Questions
Answers to questions you might have before running your numbers.
Step 1: Pick a role. Choose a position where new hires quit within 90 days because the job wasn't what they expected. VR lets candidates experience the role before accepting—the environment, the pace, the sounds. Candidates who aren't a fit opt out before you spend a dollar on onboarding. We call this closing the "Experience Gap."
Step 2: Gather your 9 data points (see next question).
Step 3: Submit and receive your report. Your personalized 13-page PDF arrives in less than 10 minutes. Download link expires in 24 hours.
You need 9 data points. Here's what they are, where to find them, and who to ask:
| # | Data Point | Where to Find It | Who to Ask |
|---|---|---|---|
| 1 | Annual Salary | HRIS (Workday, ADP, BambooHR, UKG, Paylocity) | HR Director, Compensation Analyst |
| 2 | Cost Per Hire | Finance or Recruiting — include sourcing, screening, interviewing, onboarding | TA Manager, Controller |
| 3 | Annual Hires | HRIS — total hires for this role per year | HRIS Administrator, People Analytics |
| 4 | Current Time-to-Fill | ATS (Greenhouse, Lever, iCIMS, Workable, JazzHR) | Talent Acquisition Manager |
| 5 | Target Time-to-Fill | Your goal — how many days would you like it to take? | Your judgment or industry benchmarks |
| 6 | 90-Day Turnover Rate | HRIS — (new hire separations ÷ total new hires) × 100 | HR Director, People Analytics |
| 7 | Target Turnover Rate | Your goal — what's your target for 90-day retention? | Your judgment (best-in-class: under 10%) |
| 8 | Daily Vacancy Cost | Finance or Operations — see formula below | CFO, Controller, Ops Director |
| 9 | Replacement Multiplier | See table below | Your judgment based on role complexity |
What is HRIS? Human Resource Information System — your core HR software that stores employee records.
What is ATS? Applicant Tracking System — your recruiting software that manages job postings and candidates.
Cost Per Hire: Include recruiting, screening, interviewing, and onboarding costs. Entry-level average: $1,200. National average: $4,700 (SHRM, 2022).
Target Turnover Rate: What's your goal for 90-day retention? Best-in-class: under 10%. If current is 30%, a realistic target might be 15-20%.
Daily Vacancy Cost Formula:
Daily Vacancy Cost = (Annual Salary ÷ 260 work days) × 2
Why 260? There are 52 weeks × 5 business days = 260 work days per year. This is the standard HR/Finance convention for converting annual salary to a daily rate.
Example: $52,000/year ÷ 260 = $200/day × 2 = $400/day vacancy cost
Why multiply by 2? An empty position doesn't just lose the worker's output — it creates overtime for others, delays projects, and reduces team capacity. The 2× multiplier accounts for this ripple effect.
Replacement Multiplier:
| Level | Multiplier | Examples |
|---|---|---|
| Entry-level | 0.5× | Warehouse associate, retail clerk, food service |
| Standard | 1.0× | Administrative staff, customer service, general labor |
| Skilled/Technical | 1.5× | Welders, machine operators, CDL drivers, CNAs |
| Senior/Specialized | 2.0× | Police officers, engineers, managers, licensed professionals |
Don't have exact numbers? Use your best estimates. Run the calculator twice — once conservative, once optimistic. If ROI is positive in both scenarios, you have a strong business case.
Your inputs calculate your CURRENT costs:
| Input | What It Calculates |
|---|---|
| Annual salary + Replacement multiplier | Turnover cost — what you pay to replace someone who leaves |
| Time-to-fill + Daily vacancy cost | Vacancy cost — what you lose while the position sits empty |
| Annual hires + 90-day turnover rate | Scale factor — how many times per year these costs repeat |
| Cost per hire | Direct recruiting cost — hard dollars spent per hire |
Research assumptions project your FUTURE savings:
| Assumption | Value | Source | Notes |
|---|---|---|---|
| Turnover reduction | 31% | MIT Sloan, 2020 | Agency-wide documented result; pilot showed 64% |
| Onboarding efficiency | 25% | PwC, 2020 | Derived from 4× faster training + 275% confidence |
| Time-to-fill improvement | Your target | Your input | Based on YOUR goal — not a fixed research rate |
Transparency: The 31% turnover reduction is directly documented. The 25% onboarding efficiency is derived from PwC findings, not a direct claim. Time-to-fill uses YOUR organizational target.
Your report shows Year 1 Implementation Reality (50-75% of full savings due to 6-9 month deployment) so you can see realistic expectations.
Bottom line: Current costs = 100% your numbers. Projected savings = your numbers × research-backed improvement rates.
The calculator uses a default $50,000 estimate, which typically covers:
Your actual investment may vary based on number of positions filmed, training videos needed, and organizational complexity. Organizations with 500+ employees often see stronger ROI due to economies of scale — the same investment spreads across more hires.
Run for multiple positions: Calculate your 2-3 highest-turnover roles. Total ROI = sum of savings ÷ one investment.
Share with: Finance (they'll appreciate the methodology), Operations (they feel vacancy pain daily), Executive leadership (clear ROI for budget decisions), Your direct manager (to build internal support).
Three options:
Calculate Your Immersive Recruiting ROI
Enter your numbers. Get a personalized 13-page PDF report in less than 10 minutes.